
Q1 2025 Market & Portfolio Update
Q1 2025 Market & Portfolio Update
Click here to download a printer-friendly version.
Part One: Summary of Our Macro View
As we progress into early 2025, the global economic environment continues to evolve, shaped by factors like ongoing inflation, changing monetary policies, geopolitical tensions, fluctuations in energy markets, and, perhaps most notably, the impact of the President's economic policies. Below is an updated summary of our views on these developments and their potential effects on our investment portfolios.
The Debt & Deficit Dilemma
As we have articulated in previous letters, the economic policies of the last four years have caused great concern, particularly around the inflationary impact of massive wasteful government spending and exploding fiscal deficits.
- The U.S. national debt has reached $37 trillion, with $28 trillion in marketable securities held by the public.
- One of the biggest drivers of the ballooning national debt is unchecked government spending, which has far outpaced revenue growth for decades. This issue transcends political parties, as both sides have contributed to an era of fiscal irresponsibility marked by excessive entitlement expansions, stimulus programs, deficit-funded initiatives, and a reluctance to rein in expenditures. The result is a parabolic rise in federal debt, forcing the U.S. to borrow at increasingly higher interest rates just to finance existing obligations. Without structural reforms to curb spending and prioritize fiscal discipline, debt service costs will continue to consume a growing share of the budget, squeezing out essential programs and weakening long-term economic stability.
- Nearly 47% of outstanding U.S. government debt must be refinanced within the next three years, most at significantly higher rates. According to the U.S. Department of the Treasury’s Office of Debt Management, the average interest rate on newly issued Treasury securities used to refinance maturing government debt in 2024 was approximately 3.75%, compared to 2.20% in 2019. This increase translates to roughly 70% higher borrowing costs, representing a substantial rise in absolute interest expense when applied to trillions of dollars in debt. This dynamic underscores the critical need for responsible debt management and fiscal discipline as the U.S. faces the compounding effects of higher interest costs, rising deficits, and a shifting economic landscape in a sustained higher-rate environment.
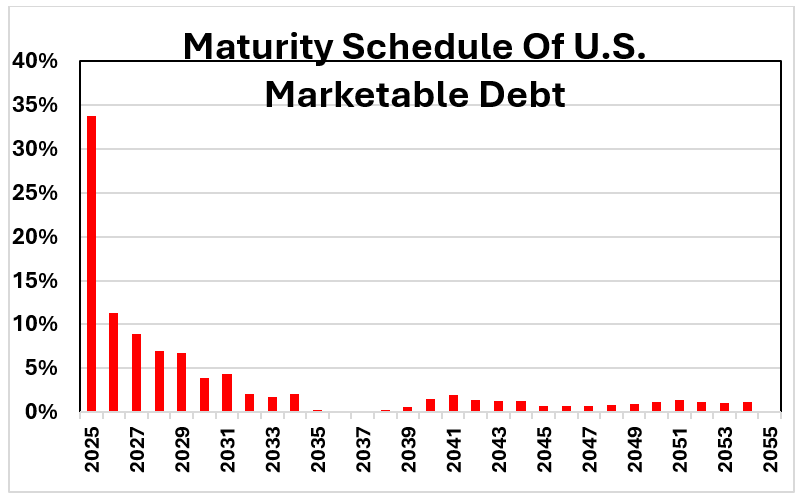
Source: Century Management, US Treasury, Bloomberg
- Interest expenses now consume roughly 17% of tax revenues, up from just 10% a few years ago.
- Without meaningful fiscal discipline, a sovereign debt crisis could emerge, placing further upward pressure on inflation and interest rates.


Investment Implications: Rising government debt and fiscal uncertainty reinforce our preference for assets that provide inflation protection and hold intrinsic value over time.
The Inflation Challenge
- Inflation has remained persistently above the Federal Reserve’s 2% target for an extended period. As seen in the table below, while inflation had been moderating in 2024, it has again risen in the past three months.

- Structural and cyclical factors continue to drive inflation higher. Tight labor markets, rising interest costs on government debt, energy price volatility, and the reshoring of U.S. manufacturing have all contributed to inflation’s persistence. Labor shortages and wage growth are keeping service-sector inflation elevated, while higher financing costs on record government debt levels are limiting fiscal flexibility. Additionally, global energy market disruptions and the shift toward domestic production are pushing input costs higher.
- The Federal Reserve cut interest rates in 2024 but remains constrained. While rate cuts were implemented to support economic growth, elevated inflation limits the Fed’s ability to ease further without risking renewed price pressures. The higher-for-longer rate environment continues to impact both consumer and corporate borrowing costs, reinforcing the importance of selectivity in portfolio positioning.
What’s often overlooked when discussing various levels of year-over-year inflation is the insidious compounding and cumulative effects of higher inflation rates on general price levels over time.
The chart below illustrates the impact of rising inflation over the past decade, covering the period from 2015 to 2024. During the first five years, cumulative inflation increased by 9.46%, averaging 1.82% annually. In contrast, the second five-year period saw a sharper rise, with cumulative inflation reaching 22.80%, or 4.12% annually. Even if year-over-year inflation moderates moving forward, the overall price level has already shifted significantly higher.

President Trump’s Economic Policies
With the new administration comes a shift in economic strategy focused on:
- Balancing trade through tariffs to reduce the U.S. trade deficit and stimulate domestic manufacturing.
- Deregulation to ease the cost of doing business in the U.S. and support growth.
- Lower taxes to encourage investment and boost consumer spending.
- Cutting wasteful government spending to improve fiscal sustainability.
Tariffs are perhaps the least understood and possibly the most controversial. Long before income tax, tariffs were the primary tool used by governments to fund the Treasury. Supporters argue that these tariffs will boost U.S. manufacturing and jobs, while critics warn that they could cause inflation, job losses, and a recession. Many point to the Smoot- Hawley Tariff Act of 1930 as a cautionary example of tariff failure. The modern U.S. economy differs greatly from the 1930s, particularly in trade. At the time of Smoot- Hawley, the U.S. was the world’s largest exporter; now, we are the world's largest importer. Today, the U.S. runs the largest trade deficit in history, meaning Americans consume and invest much more than they produce, unlike in the late 1920s when consumption was too low compared to production.
Economist Micheal Pettis describes this well in his December 27, 2024, Foreign Affairs article:
“Tariffs, which are close cousins of currency devaluation, act in the same way. They reduce domestic consumption and force up domestic savings rates. A country with low consumption and excess savings (like the United States in the 1920s or China today) tends to be one with an undervalued currency, in which case tariffs, like currency depreciation, are likely to be deflationary. But in a country with excessively high levels of consumption, like the modern United States, the same policy can be expansionary. Done under current circumstances, in other words, tariffs could increase employment and wages in the United States, raising living standards and growing the economy.”
Next, by removing unnecessary regulations, U.S. industries could expand domestic manufacturing capacity more rapidly and efficiently, quickening the pace of development, boosting labor demand, and addressing supply chain bottlenecks caused by reduced imports.
Lower taxes would leave consumers and businesses with more after-tax income, stimulating spending and investment, which would help counterbalance the impact of "tariff taxes." Critics argue that raising government revenue requires higher taxes rather than lower taxes. However, this argument overlooks two critical points:
- First, higher taxes reduce consumption, which is why the tax on cigarettes is intentionally high—to suppress demand and decrease smoking rates. Similarly, higher taxes dampen GDP growth, thereby shrinking the overall tax base.
- Second, despite significant fluctuations in tax policy—including major increases and cuts—federal tax receipts as a share of GDP have remained remarkably stable. This demonstrates a fundamental economic reality: Higher tax rates do not necessarily translate into higher government revenue. Instead, economic growth, fueled by pro-business policies and lower tax burdens, has historically been the most effective way to increase tax receipts.
The chart below is a historical representation of Federal Receipts as a Percentage of Gross Domestic Product (GDP) from 1945 to 2024, i.e., total federal tax revenues as a share of the U.S. economy. Over this period, tax revenues have ranged between 13.1% and 19.8% of GDP, with the average and median at approximately 16.8% since World War II.
This historical perspective underscores a crucial truth: sustainable revenue growth is best achieved through policies that incentivize productivity, investment, and job creation—rather than imposing excessive tax burdens that stifle economic dynamism.

Eliminating wasteful government spending and promoting economic growth by addressing the significant misallocation of capital would help reduce the fiscal deficit and alleviate pressure on government finances. As discussed above, the U.S. faces sharply higher interest expenses due to record government debt levels, rising yields on U.S. Treasury debt, and growing fiscal deficits. If these issues are not addressed swiftly, the U.S. risks heading toward a sovereign debt crisis.
In our view, it is evident that drastic measures must be taken to address the unsustainable debt-driven economic path the United States has been on before we suffer a severe national debt crisis. The combined effect of the administration’s economic policies is to rebuild domestic production, support labor and wages, improve the balance between consumption and savings, increase GDP, broaden the overall tax base, raise government revenue, and reduce the fiscal deficit.
We believe the near-term effects of these policy changes will disrupt the status quo, provoke opposition, and increase uncertainty and volatility.
Artificial Intelligence (AI) & Productivity Growth
In addition to the pro-growth policies, we believe corporate America's expanded use of Artificial Intelligence (AI) will benefit the U.S. economy. AI is already transforming industries by:
- Enhancing productivity and efficiency
- Lowering costs through automation
- Optimizing supply chains and logistics
- Improving decision-making through data analytics
Historically, technological advancements have been deflationary, offsetting labor shortages and reducing production costs. As AI adoption grows, its economic benefits will become more pronounced.
Investment Implications: Companies investing in automation, semiconductors, AI-driven logistics, and energy-efficient infrastructure will benefit in the coming years. The adoption of AI is just beginning, and it will take some time before the full economic benefits materialize.
Part Two: CM Portfolio Positioning for 2025
As we navigate the current market environment, we believe a disciplined approach emphasizing quality, valuation, strategic sector positioning, and individual stock and bond fundamentals is key. The following reflects our investment perspective based on our analysis of individual companies, sector fundamentals, historical cycles, and macroeconomic trends.
While markets continue to evolve, we see opportunities in areas that offer compelling value and attractive risk-adjusted returns. We continuously monitor market trends and individual company developments, adjusting our outlook as conditions and opportunities change.
1. Quality, Pricing Power & Balance Sheets
We are prioritizing high-quality companies with strong pricing power, solid financials, and lasting competitive advantages to navigate inflation and market cycles. This applies across all sectors, including cyclical industries like energy and industrials, where capital discipline and financial strength are essential.
- Pricing Power: Companies that can adjust prices without losing demand are better positioned to protect profits.
- Financial Strength: Focus on low debt, strong cash flow, and resilient earnings, especially in sectors prone to price fluctuations. Financial discipline is key to long-term success.
- Competitive Edge: Across all industries, cost leadership, smart capital allocation, and operational efficiency drive outperformance. Companies with disciplined management tend to lead through cycles.
2. Energy Sector
- Sustained Energy Demand & Supply Constraints: Over the past 12 months, oil prices have averaged approximately $77 per barrel, reflecting global demand growth, years of underinvestment in new supplies, and geopolitical uncertainties. While energy transition discussions continue, we believe oil and natural gas remain essential to global economic stability, industrial production, and transportation. Meanwhile, OPEC+ supply management and structural underinvestment in exploration support a tighter market and potential price appreciation.
- We believe the fair price for WTI crude oil is between $70 and $85 per barrel, as this range provides sufficient profitability to incentivize exploration and production, while remaining sustainable for consumers and industrial demand. This price balance supports long-term energy security, investment in new supply, and economic stability without creating excessive cost burdens or demand destruction.
- We Believe The Future of Natural Gas Has Never Been Brighter: Natural gas is increasingly recognized as the key bridge fuel in the energy transition, offering a cleaner alternative to coal while stabilizing renewable energy sources. Global LNG demand, particularly in Europe and Asia, is accelerating, emphasizing the need for stable long-term supply. With abundant reserves, expanding LNG export capacity, and world-class infrastructure, the U.S. is positioned as a dominant energy supplier for decades to come, especially as the sector benefits from a reduction in overregulation, which appears to be the case looking forward.
- Capital Discipline & Higher-For-Longer Prices: Unlike past commodity cycles driven by aggressive production growth, today’s energy companies are primarily focused on shareholder returns, free cash flow generation, and balance sheet strength over rapid expansion. This shift, combined with a decade of underinvestment in supply, is driving higher, more sustainable energy prices and improved industry profitability.
- Historic Valuation Opportunity: Many energy companies are trading at historically low cash flow and book value multiples, making them attractive on both an absolute and relative basis. According to Goehring & Rozencwajg, commodities—including energy—are at one of their cheapest valuations relative to equities in over a century, as seen in the Commodities-to-Dow Jones Ratio chart (August 2024). This chart depicts the ratio of the Commodity Total Return Index to the Dow Jones Industrial Average, offering insight into their relative performance over time.

- Over the past 125 years, commodities have reached their current level of undervaluation relative to equities only four times: in 1929, 1969, 1999, and 2020.
- In each case, commodities and energy stocks dramatically outperformed the broader market as capital rotated back into the sector.
- Given the structural underinvestment in energy, rising demand, and energy’s critical role in economic stability, we believe the current setup resembles past inflection points that preceded long cycles of energy outperformance.
- Energy's Low Market Weighting & Contrarian Opportunity: Despite these strong fundamentals, energy remains underrepresented in the broader market, as represented by the S&P 500 Index, with the energy sector allocation near historical lows at ~3.15% (i.e., 20-year average ending 2024 has been ~7.3%), while the technology sector sits near historical highs at ~32% (i.e., 20-year average ending 2024 has been ~21%). This extreme divergence in sector weightings suggests energy is deeply undervalued relative to consensus expectations. While this position may go against prevailing market sentiment, we believe this sector offers compelling long-term value, and we are positioned accordingly.
- Commodities as a Strategic Hedge: With many equity valuations at or near historical highs and persistent inflationary pressures, we believe energy and commodities serve as an important hedge against monetary debasement, supply shocks, and financial instability. Historically, when commodities reach extreme undervaluation levels, they tend to deliver significant outperformance in the years ahead, a trend we believe is now underway.
3. Gold as a Hedge
- Gold remains a core position as a strategic hedge against inflation, currency debasement, and financial instability. Given the current macroeconomic environment, we are primarily allocated to physical bullion, which we believe offers the most direct and effective protection against systemic risks and market volatility.
- While we continue to monitor opportunities in gold-related equities, we currently prefer the stability and intrinsic value of bullion as a long-term store of wealth.
4. Select Opportunities in Industrials & Financials
- Industrials: We see strong potential in industrial firms leveraging infrastructure expansion, manufacturing growth, and AI-driven productivity enhancements. Companies benefiting from reshoring trends, automation, and increased capital investment are positioned to gain as businesses adapt to evolving supply chain dynamics and technological advancements.
- Financials: We see selective opportunities in the financial sector, particularly in health insurance and reinsurance companies. Rising healthcare costs and demographic shifts continue to drive demand for managed care services, while reinsurers stand to benefit from firming pricing dynamics and improved underwriting profitability.
An added advantage of health insurers and reinsurers is that their policies are typically structured on annual contracts, allowing them to reprice regularly to account for inflation and evolving risk factors. This flexibility helps protect margins and maintain profitability even in changing economic conditions.
Companies with strong risk management, disciplined capital allocation, and diversified revenue streams are best positioned to navigate market fluctuations and capitalize on industry tailwinds. In a higher interest rate environment, firms with conservative balance sheets and effective capital deployment should continue to perform well.
5. Technology & AI Exposure
We continue to identify compelling opportunities in automation, artificial intelligence (AI) software, and semiconductor firms that are driving next-generation efficiency, productivity, and cost reduction across industries.
- Automation & AI Software: Advances in machine learning, data analytics, and robotics are transforming industries by reducing labor costs, optimizing supply chains, and improving decision-making. AI adoption is accelerating, particularly in cybersecurity, healthcare, and financial services as companies seek to enhance efficiency and competitiveness.
- Semiconductors & Critical Components: As AI and automation expand, demand for high-performance computing chips, AI accelerators, and specialized semiconductors is surging. Beyond semiconductors, automation and robotics also rely on key supporting technologies such as high-precision sensors, advanced ball bearings, sophisticated actuators, and efficient power management systems. These components are essential for ensuring accuracy, reliability, and energy efficiency, driving the continued evolution of intelligent systems.
- We are focused not only on leading AI and semiconductor firms but also on the critical suppliers—the “picks and shovels” of the industry—that provide essential components up and down the supply chain. By identifying companies with strong R&D investment, strategic positioning, and scalable business models, we aim to capture opportunities across the broader AI and automation ecosystem.
6. Short-Term Treasuries & Cash Equivalents
With yields at multi-year highs, short-term U.S. Treasuries provide a rare combination of safety, liquidity, and attractive returns. As of early 2025, 3-month Treasury bills yield around 4.20%, while 1-year Treasuries exceed 4.5%, making cash a viable asset class once again.
Unlike the past decade, when cash offered little return, today’s environment allows investors to earn meaningful income while preserving flexibility. We believe that staying short on duration allows investors to capture higher yields while managing interest rate risk.
Rather than extending into long-duration bonds at uncertain rates, we favor short-term Treasuries and select corporate bonds, balancing yield, liquidity, and downside protection in an evolving market.
7. Corporate Bonds in Balanced & Fixed Income Accounts
- We find individual corporate bonds offer compelling value for balanced and fixed income portfolios.
- We currently favor a mix of short-duration U.S. Treasuries and investment-grade corporate bonds to manage interest rate risk while capturing attractive yields.
- Given that corporate bonds currently yield a meaningful premium over similar-maturity Treasuries—and with our preferred portfolio duration of 3 to 3.5 years—we believe high-quality corporate bonds effectively balance income generation with risk management.
- Amid fiscal uncertainty and persistent inflation, these bonds offer competitive yields and preserve flexibility, making them a valuable part of our diversified fixed income strategy.
Part Three: Final Thoughts
The investment landscape in 2025 is both complex and full of opportunity. Inflation remains elevated, fiscal challenges persist, and policy shifts will take time to unfold. However, history has shown that sound investment principles—focusing on quality, valuation, and long-term fundamentals—remain the best guide in uncertain times.

We remain committed to preserving and growing capital while staying flexible as market conditions evolve. As always, we appreciate your trust and are available to discuss any questions or adjustments to your portfolio.

Sincerely,
Arnold Van Den Berg, Founder and CEO
Jim Brilliant, CIO, Portfolio Manager, CFA
Scott Van Den Berg, President, CFP®, ChFC®, CEPA®, AIF®
Aaron Buckholtz, Portfolio Manager, Head of Trading, CFA
Century Management ("CM") is an independently registered investment adviser with the U.S. Securities and Exchange Commission. Registration does not imply a certain level of skill or training. CM is also registered as a Portfolio Manager in the Province of Ontario. A full description of our Firm’s business practices, including our Firm’s investment management services and advisory fees, is supplied in our Form ADV Part 2A and/or Form CRS, which are available upon request and also at www.centman.com.
Past performance is not indicative of future results. The discussions, outlook, and viewpoints featured are not intended to be investment advice and do not take into account specific client investment objectives. CM reserves the right to modify its current investment strategies and techniques based on changing market dynamics or client needs. It should not be assumed that the industries and sectors discussed were or will prove to be profitable, or that the investment recommendations or decisions we make in the future will be profitable. Forward-looking statements are not guaranteed.
Positions held within each individual account may not be the same from one account to the next. Individual securities may be traded at different times as well as receive different execution prices. In addition, individual accounts may be pursuing similar objectives but may have different investment restrictions. All investments involve risk and, unless otherwise stated, are not guaranteed. CM-2025-03-04